
I’d dearly love to build up a picture of what happens to my sugar throughout the day. Ideally, it should be pretty much a flat line, so I wonder how much I vary from that? Today is a bank holiday here in the UK so I’m going to be stuck at home all day. To this end, I’m going to not only record what I eat (I’ve done this occasionally anyway) also to take my meds as normal, but also to record my sugar every hour or so. As regards eating, I’m going to try and keep the day as “typical” as possible, obviously subject to hunger pangs.
I’ll start by recording my “getting up” sugar, and at the end of the period will try to construct a graph to make things easier to interpret. Unfortunately the blogging platform that I use (blogger.com) doesn’t allow me to present something as sophisticated as a spreadsheet in my entries, so I’ll unless I can think of a better option, I’ll probably end up taking a screenshot and posting the image or two….The values themselves I can put in a table.
| Time of Day | Sugar (mmol/l) | Event |
|---|---|---|
| 08:30 | 10.2 | Getting up test |
| 09:30 | 10.4 | Test |
| 09:45 | Morning Meds plus breakfast. Insulin (44 Units), BP Meds, then Redbush Tea (no milk), Porridge (milk and oats, garnished with sultanas). The food should raise my sugar, but the insulin will lower it | |
| 10:30 | 12.2 | Test |
| 11:30 | 13.1 | Test |
| 12:30 | 10.7 | Test |
| 13:30 | 7.7 | Test |
| 13:45 | Lunch. 3 pieces wholemeal bread, sliced chicken breast sandwiches, low fat/sugar yoghurt, clementine, black tea | |
| 14:30 | 9.4 | Test |
| 15:30 | 10.6 | Test |
| 16:30 | Afternoon nap! | |
| 17:00 | 13.8 | Test |
| 17:15 | Snack: Tea and 4xCrackers | |
| 18:10 | 13.0 | Test |
| 19:00 | 12.1 | Test |
| 19:45 | Evening Insulin (44 units) | |
| 20:00 | 13.4 | Test |
| 20:15 | Supper: dusted fish, oven chips, peas, tea, zero-fat yoghurt | |
| 21:00 | 12.3 | Test |
| 21:45 | 14.2 | Bedtime Test |
| 05:30 Saturday | 11.3 | Test. Got up for a pee |
These numbers all translate into a graph below. I’ve tried to adjust the colours so as to improve the contrast:
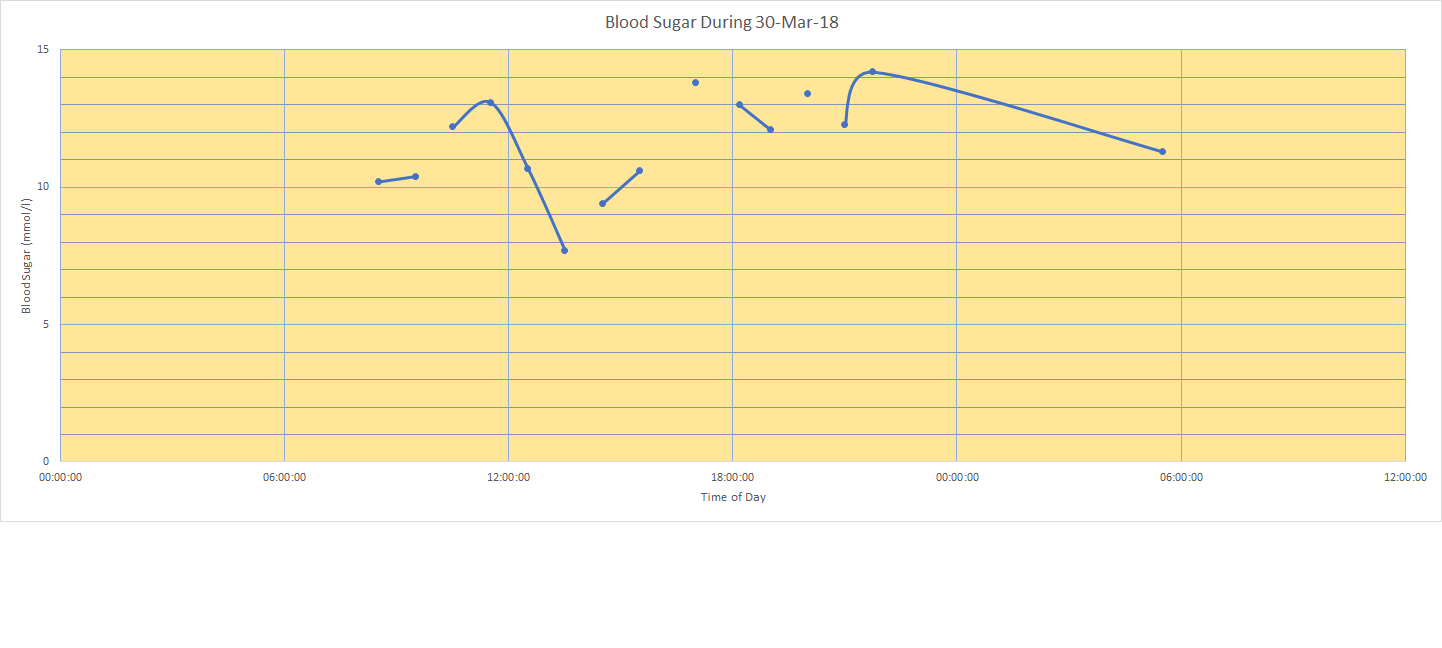 |
| Blood Sugar 30-Mar-2018 |
Observations:
- it looks a bit like a sine wave, centred around 10 mmol/l and varying maybe ±5 mmol/l, give or take. I’m not sure how I can reduce the variation unless I lower my second insulin dose, and then add another one at 3 or 4PM
- First thing in the morning, before I eat anything, my sugar stats pretty steady. I wonder, if I just spent the day not eating and not taking meds, whether that would still be the case? Logic would dictate that just day-to-day living would consume energy, so eventually sugar levels would get lower
- The morning insulin took me down to about 7, so I’d be reluctant to increase it further just yet
- I seemed to reach a peak up to about six o’clock, then my sugar went down naturally, without insulin. I didn’t have my second insulin dose until around 8PM
- That my basal level was slightly higher on Saturday morning than on Friday morning is probably something to do with having chips for supper. For that reason I’d be reluctant just to perform a blanket raise my evening insulin, irrespective of the food I eat
- The fast insulin has nowhere near the effect of the slow insulin. But there again, it does form only a quarter of the mixture
- I don’t eat much food these days!
- I need to be careful about how much I read into these numbers, as in many cases we could be talking about the tolerance of the glucometer itself. I wouldn’t want to assume that the glocometer was any more accurate than +/- 10%, despite what marketing material might say
- The glucometer needs new batteries and my fingers (bear in mind I test on just one hand) feel like a pin cushion!

And the astute reader might well have noticed that I forgot my evening BP meds. I don't often forget them, maybe I was thinking too much about my bedtime sugar test instead? I got them on Saturday night.
LikeLike